See what your website is really costing you.
Three numbers set your baseline: visitors, conversion rate and order value. Adjust them below and watch the effect on revenue in real time — no email required.
Start with your numbers
Estimates are fine. Every field has an industry benchmark so you're never guessing blind. Each converting visitor counts as one order.
Independent restaurants with a strong online presence see 5,000–15,000 visitors a month.
Typical restaurant sites convert 3–4%. Optimized platforms hit 5.5–6.3%.
Canadian takeout averages $38–$55 per order; full-service takeout often runs higher.
Orders per month
400
Monthly online revenue
$30,000
Annual online revenue
$360,000
Visitors × conversion rate × average order value = monthly revenue, counting one order per customer.
Where the leak actually happens
Your conversion rate isn't one number — it's four stages multiplied together. Drag any stage to see what fixing that drop-off is worth; Step 1's conversion rate updates with it.
1. Visitors who open the menu
61.8%About 6,176 of your 10,000 monthly visitors still make it this far.
Why they leave: Slow-loading pages and a menu buried behind a PDF or third-party link.
MenuLogic fix: Instant-loading menu on your own domain — no redirects, no PDFs.
2. Menu viewers who add an item
18.5%About 1,144 of your 10,000 monthly visitors still make it this far.
Why they leave: Text-only menus. Hungry people buy what they can see.
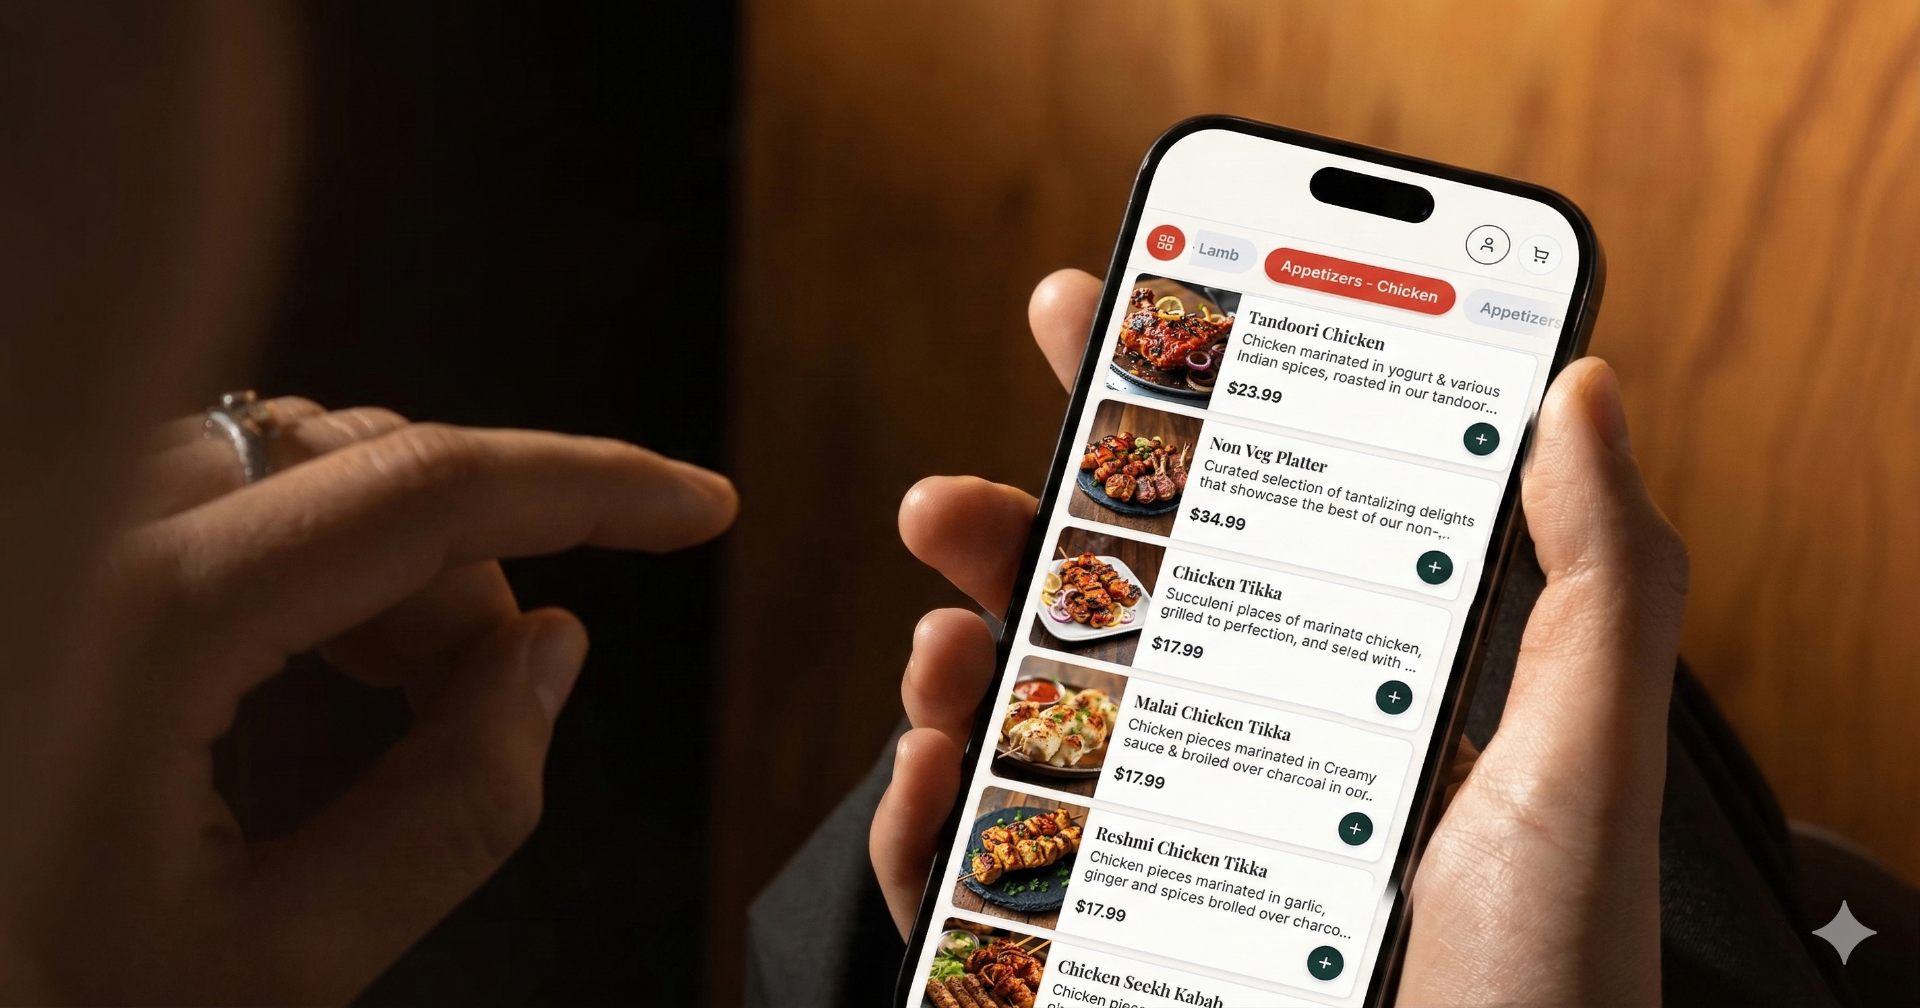
MenuLogic fix: High-quality photos, descriptions and popular-item badges on every dish.
3. Carts that reach checkout
61.8%About 707 of your 10,000 monthly visitors still make it this far.
Why they leave: Carts abandoned with no follow-up — the order is simply gone.
MenuLogic fix: Automated cart-abandonment SMS and email that pull them back.
4. Checkouts that become orders
56.6%About 400 of your 10,000 monthly visitors still make it this far.
Why they leave: Forced account creation, surprise fees and clumsy payment steps.
MenuLogic fix: Guest checkout, saved cards, Apple Pay and transparent pricing.
Now run the what-if
These defaults are deliberately conservative — the mid-range of what restaurants typically see in their first few months on MenuLogic.
Conversion lift
+40%4.0% → 5.6% conversion
Instant page loads, photo-rich menus and guest checkout. This is the single biggest lever on the list.
Average order value lift
+12%$75 → $84 per order
Smart upsells, combos and image-rich modifiers nudge each basket up without raising prices.
Traffic growth
+12%10,000 → 11,200 monthly visitors
Automated Google review collection, built-in SEO and campaign links bring more people to your own site.
The compounded result
Revenue you're leaving on the table
$272,218 / year
Small improvements multiply. A 20% lift on each of the four variables doesn't add up to 20% — it compounds into far more.
Projections are estimates based on the values you enter and typical results across independent restaurants. They are not a guarantee of performance.